
Industry News
Curation by industry experts
Hot Articles
Popular Tags
Thermal Retention Technology Testing: Common Errors That Skew Results
In thermal retention technology testing, the difference between a reliable result and a misleading one is often small. A lid left open too long, a poorly stabilized sample, or an inconsistent fill volume can distort heat-loss data enough to affect sourcing, benchmarking, and product claims. For insulated drinkware, cookware, and adjacent housewares, that matters because thermal performance is tied to material choice, manufacturing quality, user experience, and retail positioning.
Within CHHS coverage, thermal retention technology sits at the intersection of stainless steel processing, vacuum insulation, food-contact compliance, product design, and export evaluation. Test results are not only technical records. They influence how products are compared, how suppliers are screened, and how performance promises are defended in commercial settings.
Why thermal retention results are easy to misread
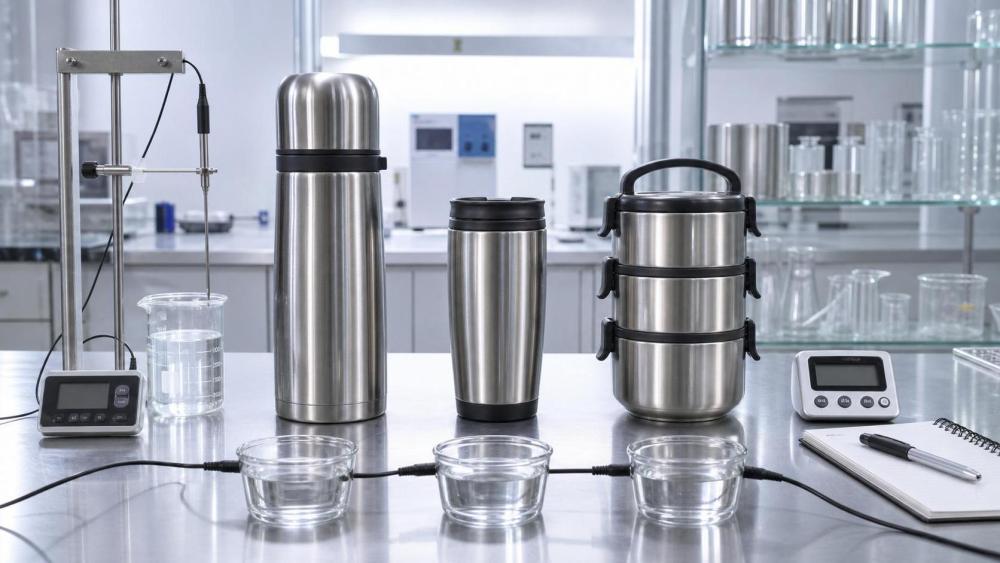
Thermal retention technology testing looks straightforward on paper. Fill the product, measure temperature, wait, and measure again. In practice, the result reflects a chain of variables rather than one isolated property.
A vacuum bottle may appear strong because of a favorable room condition. A pan may seem weak because the starting surface temperature was uneven. A plastic outer shell may alter handling heat, even when core retention is unchanged.
This is why thermal retention technology should be assessed as a system. Container geometry, wall construction, weld quality, lid sealing, liner material, coating, and test discipline all affect the outcome.
The measurement is only as stable as the method
Many comparison errors happen because products are tested under conditions that are technically similar, but not operationally equivalent. Small deviations compound over several hours and make weak products look acceptable.
For CHHS-relevant categories, this issue appears most often in insulated mugs, thermos bottles, food containers, and multi-material cookware. It also matters when product teams compare 304 and 316 stainless steel vessels or evaluate copper-plated vacuum structures.
Common testing errors that skew heat-holding data
The most frequent mistakes are not dramatic. They are routine procedural gaps that reduce repeatability and make cross-supplier comparison unreliable.
Uncontrolled starting conditions
If the initial water temperature varies by even a few degrees, the final retention percentage becomes hard to compare. The same problem appears when samples begin at different body temperatures.
Preheating is another overlooked factor. Some vessels are tested after preheating, others are not. That changes early heat loss and can make one design appear better than another.
Inconsistent fill volume and headspace
Thermal retention technology is sensitive to how much air remains inside the product. More headspace usually means faster heat loss, especially in smaller drinkware.
Comparing a 90 percent fill against a near-full fill is not a valid performance comparison. The container volume, fill mass, and closure condition should be fixed before testing starts.
Ambient conditions that drift during the test
Room temperature, airflow, humidity, and surface contact all influence measured cooling. Air conditioning vents, direct sunlight, and metal worktops create hidden biases.
A bottle placed near moving air may lose heat faster than an identical sample in a calm area. That is not a product difference. It is a setup problem.
Probe placement and reading errors
Temperature readings can shift depending on where the probe sits. Near-wall readings may differ from center-mass readings, especially in larger containers or layered cookware.
Opening the lid too long to take a measurement also releases heat. Repeated intrusive sampling can damage the very result being recorded.
Confusing user convenience with thermal retention
A flip lid, straw port, or vented closure may improve daily use but reduce insulation efficiency. Testing should separate convenience features from pure thermal retention technology performance.
Otherwise, products with different use intentions are judged by one narrow metric. That can lead to unfair rejection or poor category planning.
Where these errors matter most in real product evaluation
The impact of bad testing varies by product type. Some categories are more exposed to distorted data because their construction, usage pattern, or claim language is more sensitive.
In sourcing and compliance review, these mistakes create downstream cost. Retesting delays launches. Incorrect claims increase dispute risk. Weak comparisons reduce confidence in supplier qualification.
How to build a more dependable thermal retention protocol
A useful protocol does not need to be complicated. It needs to be controlled, documented, and repeatable across samples, batches, and factories.
Standardize the setup before comparing products
- Use a fixed starting liquid temperature and confirm it with calibrated instruments.
- Set one fill ratio for all samples and record net volume or mass.
- Define whether preheating is included, and keep it consistent.
- Control the room environment and surface material during hold time.
- Limit lid opening and use a repeatable reading interval.
Match the method to the actual use case
Thermal retention technology should be tested in a way that reflects intended use. A commuting mug, a soup jar, and a hospitality carafe do not face the same opening frequency or fill behavior.
This point is often missed when a single internal method is applied to every SKU. The result may be tidy, but it may not be commercially useful.
Document construction variables, not only final numbers
Retention data means more when linked to product structure. Vacuum level, liner thickness, stainless grade, copper coating, seam quality, and closure design should be noted with the result.
That approach supports trend analysis across batches and helps explain why two products with similar appearance perform differently.
What to watch when reviewing supplier data
Supplier reports often present a clean retention curve, but the decision value lies in the test conditions behind it. Without those details, thermal retention technology claims are difficult to verify.
Useful questions include whether the sample came from pilot production or mass production, whether the lid was fully assembled, and whether the tested unit reflects export packaging conditions.
It is also worth checking whether the same protocol was used for all competing models. A stronger chart is not meaningful if the methods changed between samples.
Signals that deserve closer scrutiny
- Very high retention claims with limited procedural detail
- No mention of calibration, ambient temperature, or fill ratio
- Single-sample results presented as batch performance
- Data that ignores lid type or accessory configuration
- Results that conflict with known material or structure limits
For CHHS-oriented category analysis, this level of review helps connect thermal data with material safety, manufacturability, and retail reliability instead of treating retention as an isolated headline number.
A better basis for comparison and next steps
Thermal retention technology testing becomes more useful when it moves beyond pass-or-fail thinking. The goal is not simply to find the hottest final reading. It is to build a comparison method that survives commercial scrutiny.
A practical next step is to review current test sheets for missing variables, then align product categories with use-based protocols. After that, compare retention data alongside construction details, compliance readiness, and production consistency.
That approach creates stronger decisions across insulated drinkware, cookware, and related housewares. It also turns thermal retention technology from a marketing claim into a traceable performance indicator that supports product evaluation with more confidence.
Recommended News